I believe the best way to introduce clients and prospects to the InteractFA tools is to start with the posters.
I recommend you place them at eye level in a prominent area of the office like a lobby or conference room. If you leave a prospect (or client who hasn’t seen them yet) alone with them, their curiosity will kick in and the gears start turning before you explain what they represent.
I can’t overemphasize the importance of just letting them look and think about what they might be seeing. Each poster has very powerful visual characteristics that will make an immediate impression. Once you get around to explaining each one, it’s almost certain you’ll be reinforcing and enhancing these impressions. Rather than presenting what you do and why, you’re allowing the prospect/client to educate themselves on core investing principles in a very unique and powerful way. Believe me, the “Ah ha!” moments will be very frequent and satisfying.
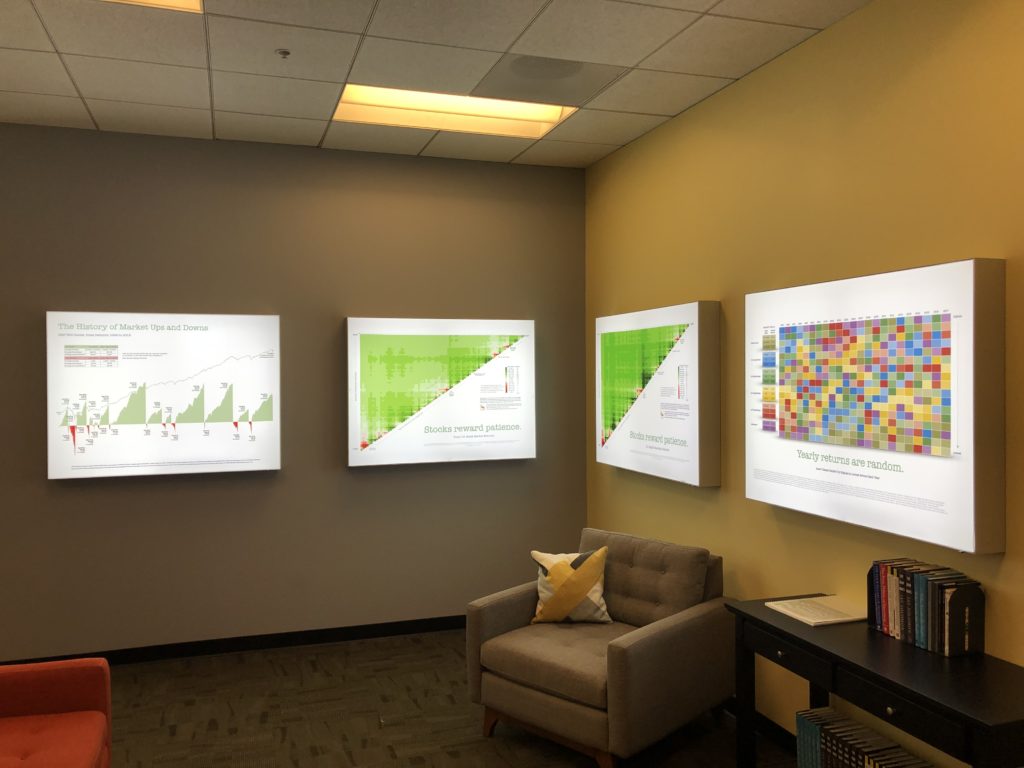
In our Equius office, we display four posters in the following order left to right:
1. A History of Market Ups and Downs
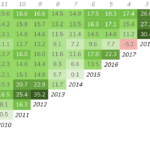
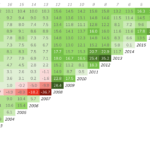
2. Core version of US Total Stock Market Matrix (no returns in cells)
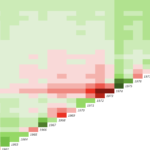
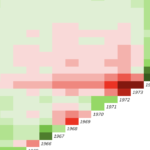
3. Core version of US Small Value Stock Matrix (no returns in cells)
4. Yearly Returns Are Random—Without returns
If you chose only one poster, I recommend #2. You can cover all the core principles—except the benefits of asset class diversification—using the US Total Stock Market Matrix graphic. I highly recommend you do not use the version with returns in the cell. If you do, I guarantee the returns will be the immediate and ongoing focus and you might as well just use Dimensional’s Matrix Book instead.
If you choose two posters, #2 and #3 are really powerful. Most of your interaction with the client/prospect will be with the US Total Market poster. What they’ll notice immediately when you move to the US Small Value poster are the deeper greens throughout (prompted by the question “What do you see that’s different with this graphic?”). This begins the discussion of the power of asset class diversification without getting into the weeds of model simulations. That’s likely to come later in any case. This first introduction to the higher expected returns (and risk) of small value stocks “sets the table” nicely.
It’s likely your client/prospect has seen graphics similar to both #1 and #4. With the first one, we’ve taken “bull and bear” markets out of the narrative because those are traditional Wall Street terms having more to do with fear and greed emotions than efficient market principles (changing fundamentals, expectations, etc.).
With “Yearly Returns Are Random” we’ve limited the asset classes to what we consider the core in developing an efficient portfolio and taken labels and returns out of the cells. This is our anti-market timing investing image.
My thinking with all the images has been to keep them as simple and uncluttered as possible in order to focus on just a core set of investing principles. Too much annotation, too many different types of graphs on one poster, and certainly hundred or thousands of returns can be overwhelming and too easy for clients or prospect to miss “the big picture.”
As a footnote, our experience with the posters at Equius has been so positive that we decided to create “light box” versions for our walls. These can be special ordered for you as well. Just send me an email expressing interest and I’ll call to discuss the process and cost with you.